Cassiopeia A recorded with SPIDER 300A radio telescope
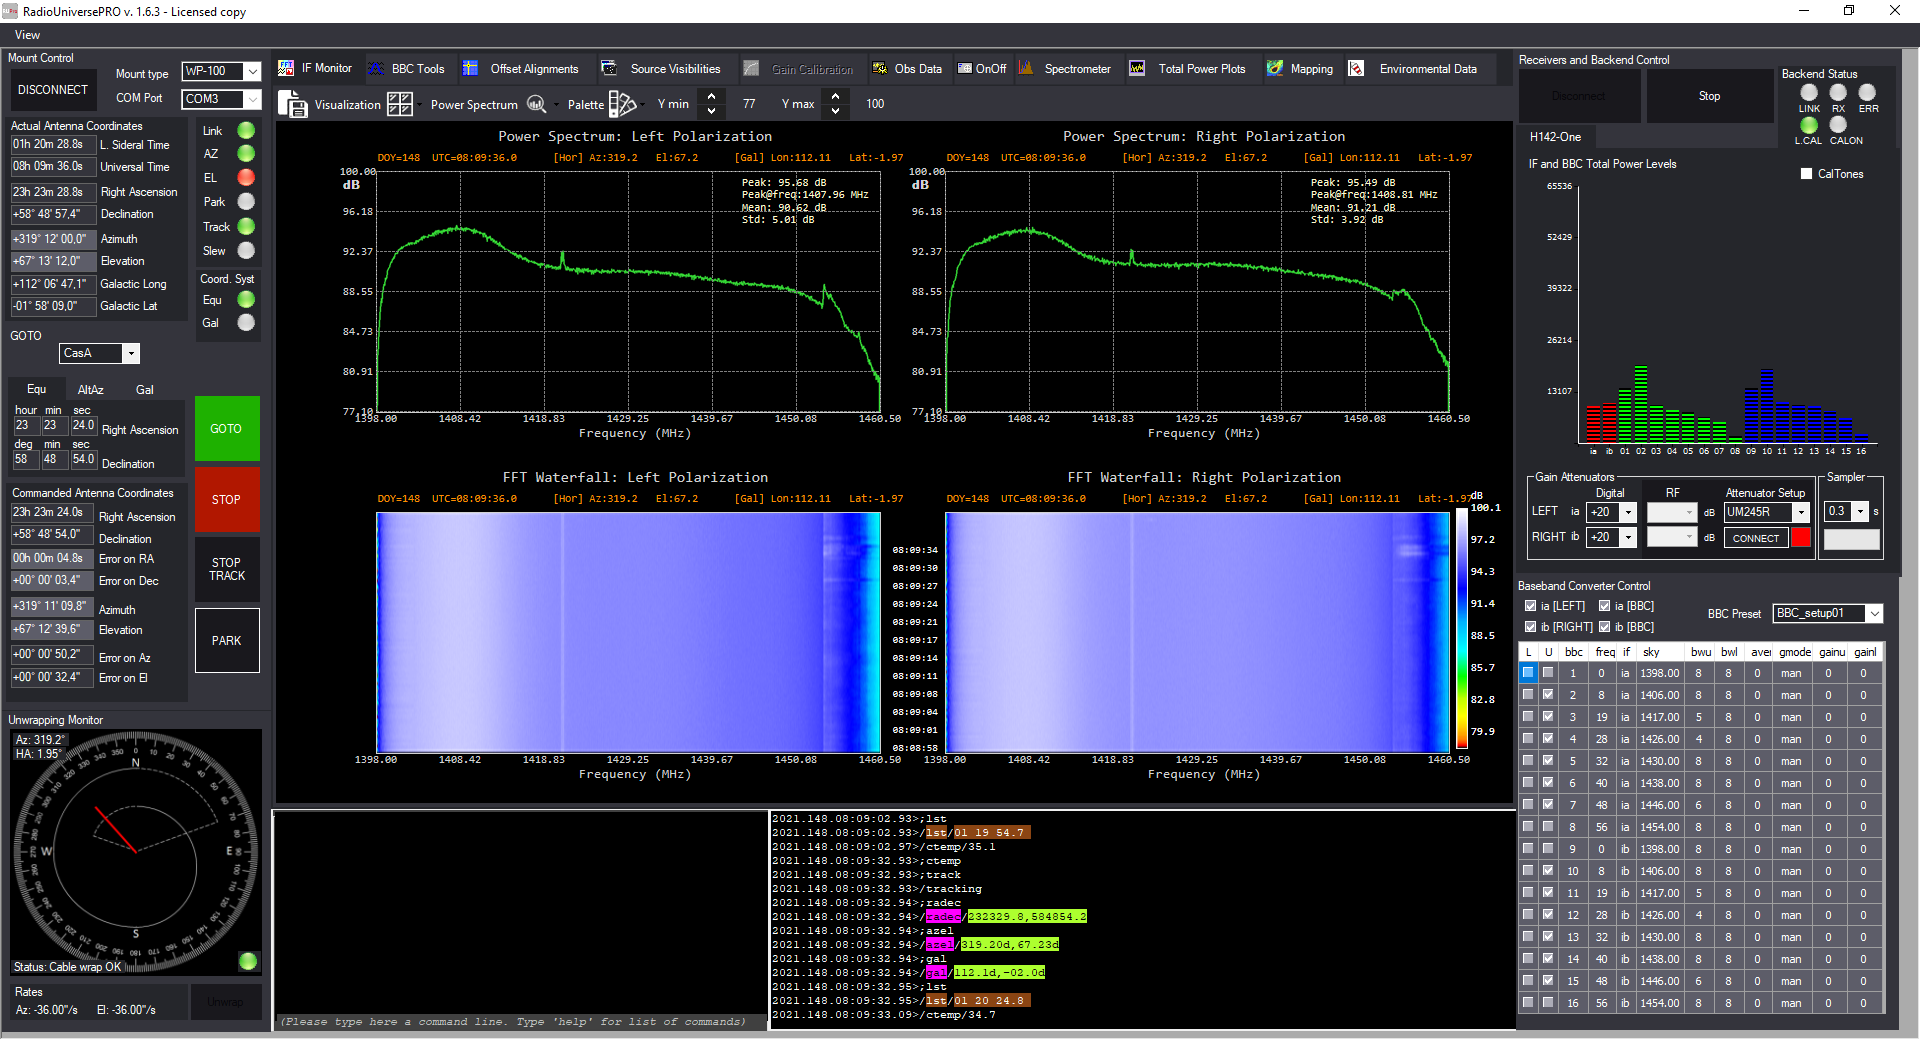
Cassiopeia A it’s an important object for radio astronomy, a supernova remnant located in Cassiopeia constellation with a flux of 2400 Jansky at 1420 MHz. For this article we used the SPIDER 300A radio telescope that, thanks to the 3 meter parabolic antenna with high precision WP-100 mount, high sensitivity H142-One receiver, and the advanced features of the RadioUniversePRO software, is able to detect Cassiopeia A. The radio telescope is connected to the remote control room by using the Radio over fiber kit for SPIDER radio telescope that removes the normal gain loss because of cable length and improve even more performances of the radio telescope.
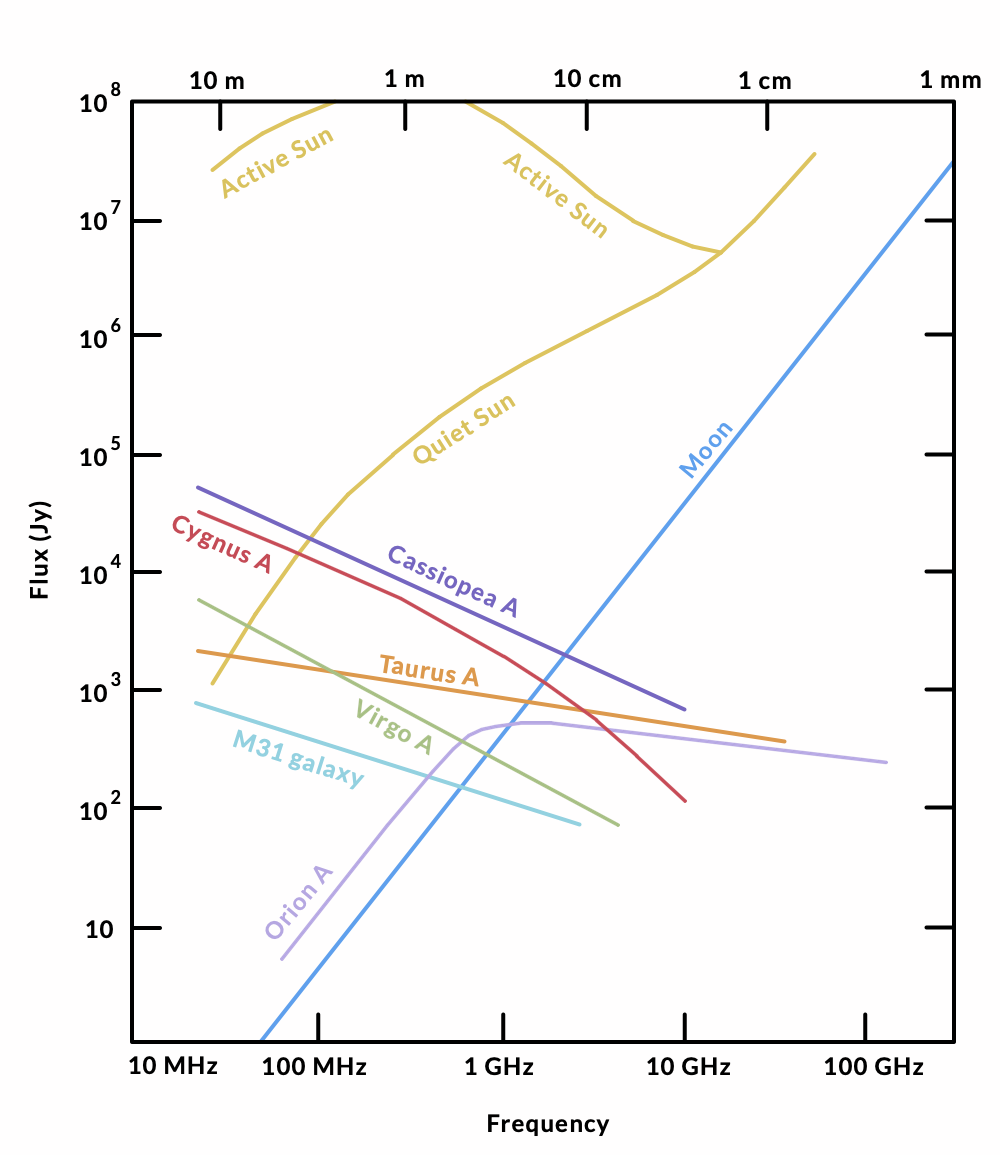
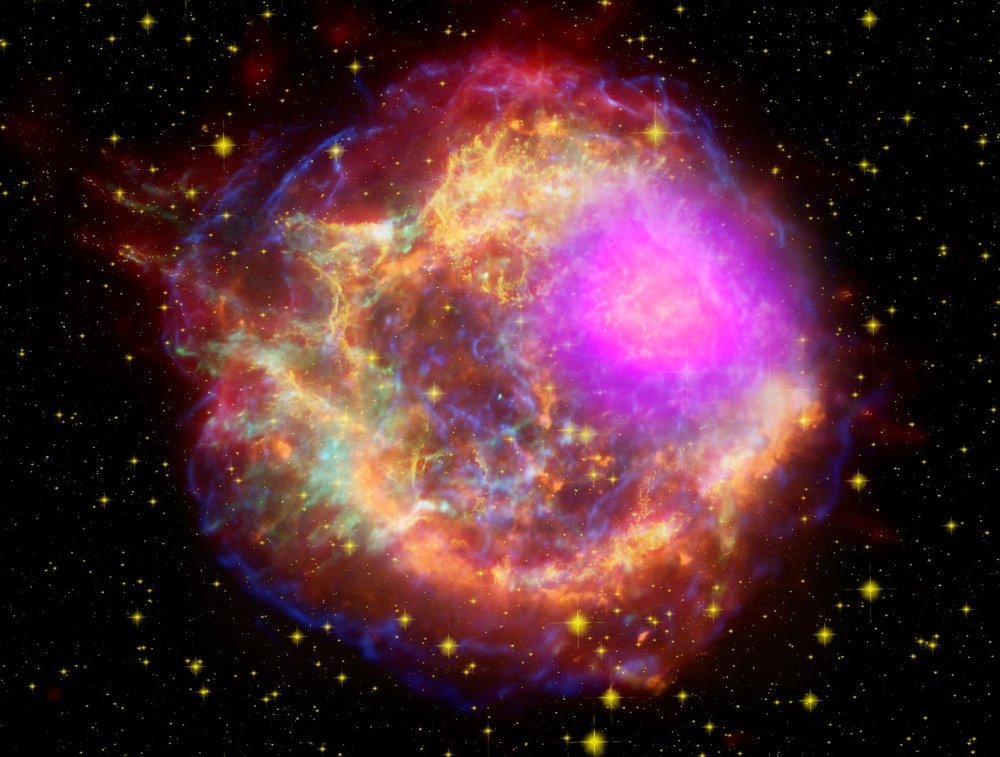
Cassiopeia A is a very interesting object to study since, in visible frequencies, it’s extremely weak since it’s hidden behind the interstellar dust of the Milky Way plane which absorbs the visible radiation. That’s why Cassiopeia A (also called Cas A) was identified in radio wavelengths only in 1947 (Cassiopea A was one of the first radio sources to be identified) and the optical counterpart was identified in 1950. Most probably Cassiopeia A has been generated by a supernova event (exploded about 11,000 years ago and that reached the Earth about 300 years ago) from sixth magnitude star 3 Cassiopeiae, that John Flamsteed cataloged by August 16, 1680. Cassiopeia A .
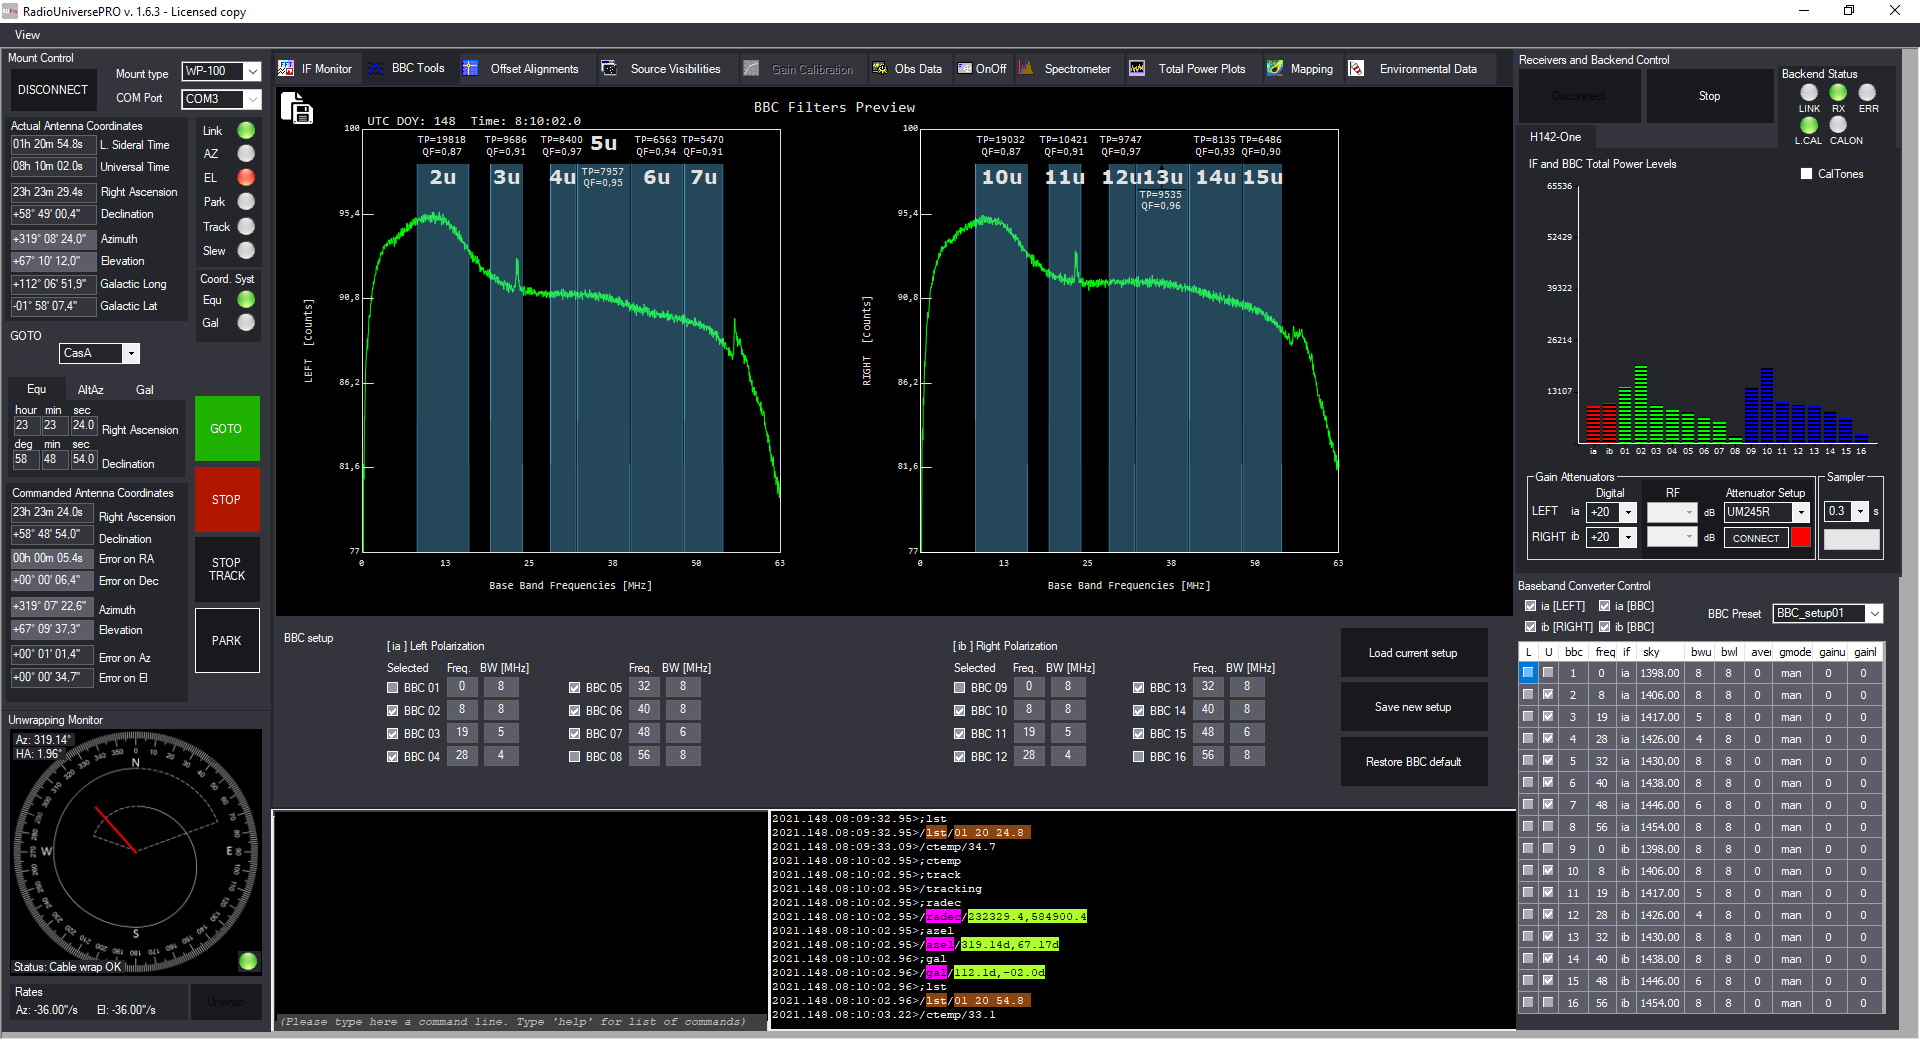
When we want to record weak radio signals coming from Cassiopeia A (this is valid for all the radio sources except for the Sun) we have to be sure that the radio telescope is correctly aimed to the right sky area: in fact we can’t directly see the object we want to study. In order to do so, we took advantage of the high pointing precision of the WP-100 mount of the SPIDER 300A radio telescope. Source Visibilities tab of RadioUniversePRO allows you to check the visibility of many radio sources and we used this feature to verify that Cassiopeia A had a good elevation from the ground. In fact we recommend to study radio sources that are least at 30 degrees from the ground. Then we made a double-click on Cassiopeia A row and SPIDER radio telescope automatically pointed at it. Before starting to record data, we used the BBC Tool feature of RadioUniversePRO to check for interferences in the 50 MHz bandwidth (centered at 1420 MHz) recorded by the SPIDER radio telescope. As you can see in the image below, the neutral Hydrogen line (1420 MHz) is clearly visible along with some artificial interferences. By using the BBC Tool feature of RadioUniversePRO we can easily remove the interferences and allow the SPIDER radio telescope to record valid data without artificial radio signals.
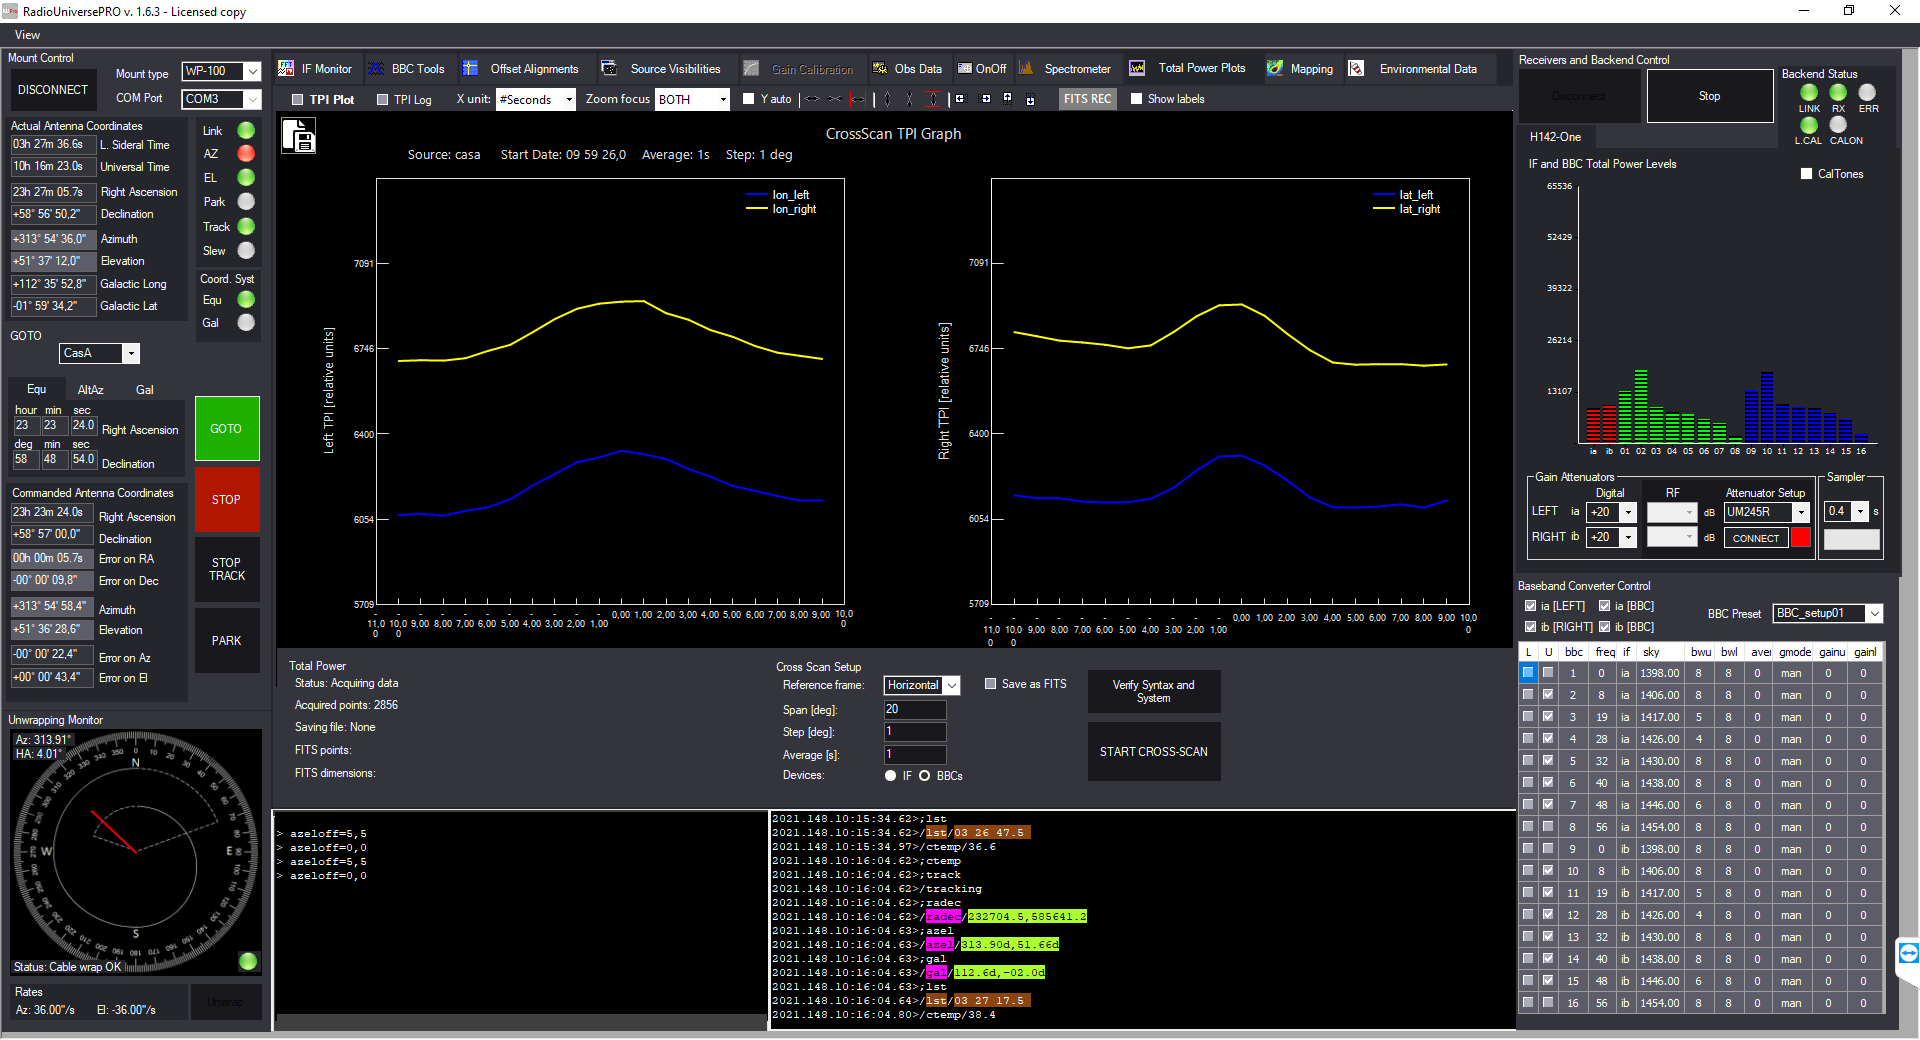
Having correctly pointed the radio telescope and removed interferences, we started recording many results on Cassiopeia A. First of all we started capturing a Cross-Scan: this technique involves recording a transit in both Elevation and Azimuth, centered on the object. This way we get a graph of the intensity of the radio emission along a cross centered on the object and that allows to determine the maximum radio emission of Cassiopeia A. In order to perform this operation, we select the “TPI Plot” tab in RadioUniversePRO and we use the Cross-Scan feature. Here you can set the length of the scan, the separation of each record point and the integration time of each record point. The SPIDER radio telescope mount moves the antenna and the software creates a graph like the one you can see in the image below. We clearly noticed the increase in the recorded radio value caused by Cassiopeia A. In this way we also verified that the SPIDER radio telescope mount is perfectly aligned on the radio sources in the sky and that Cassiopeia A was perfectly framed.
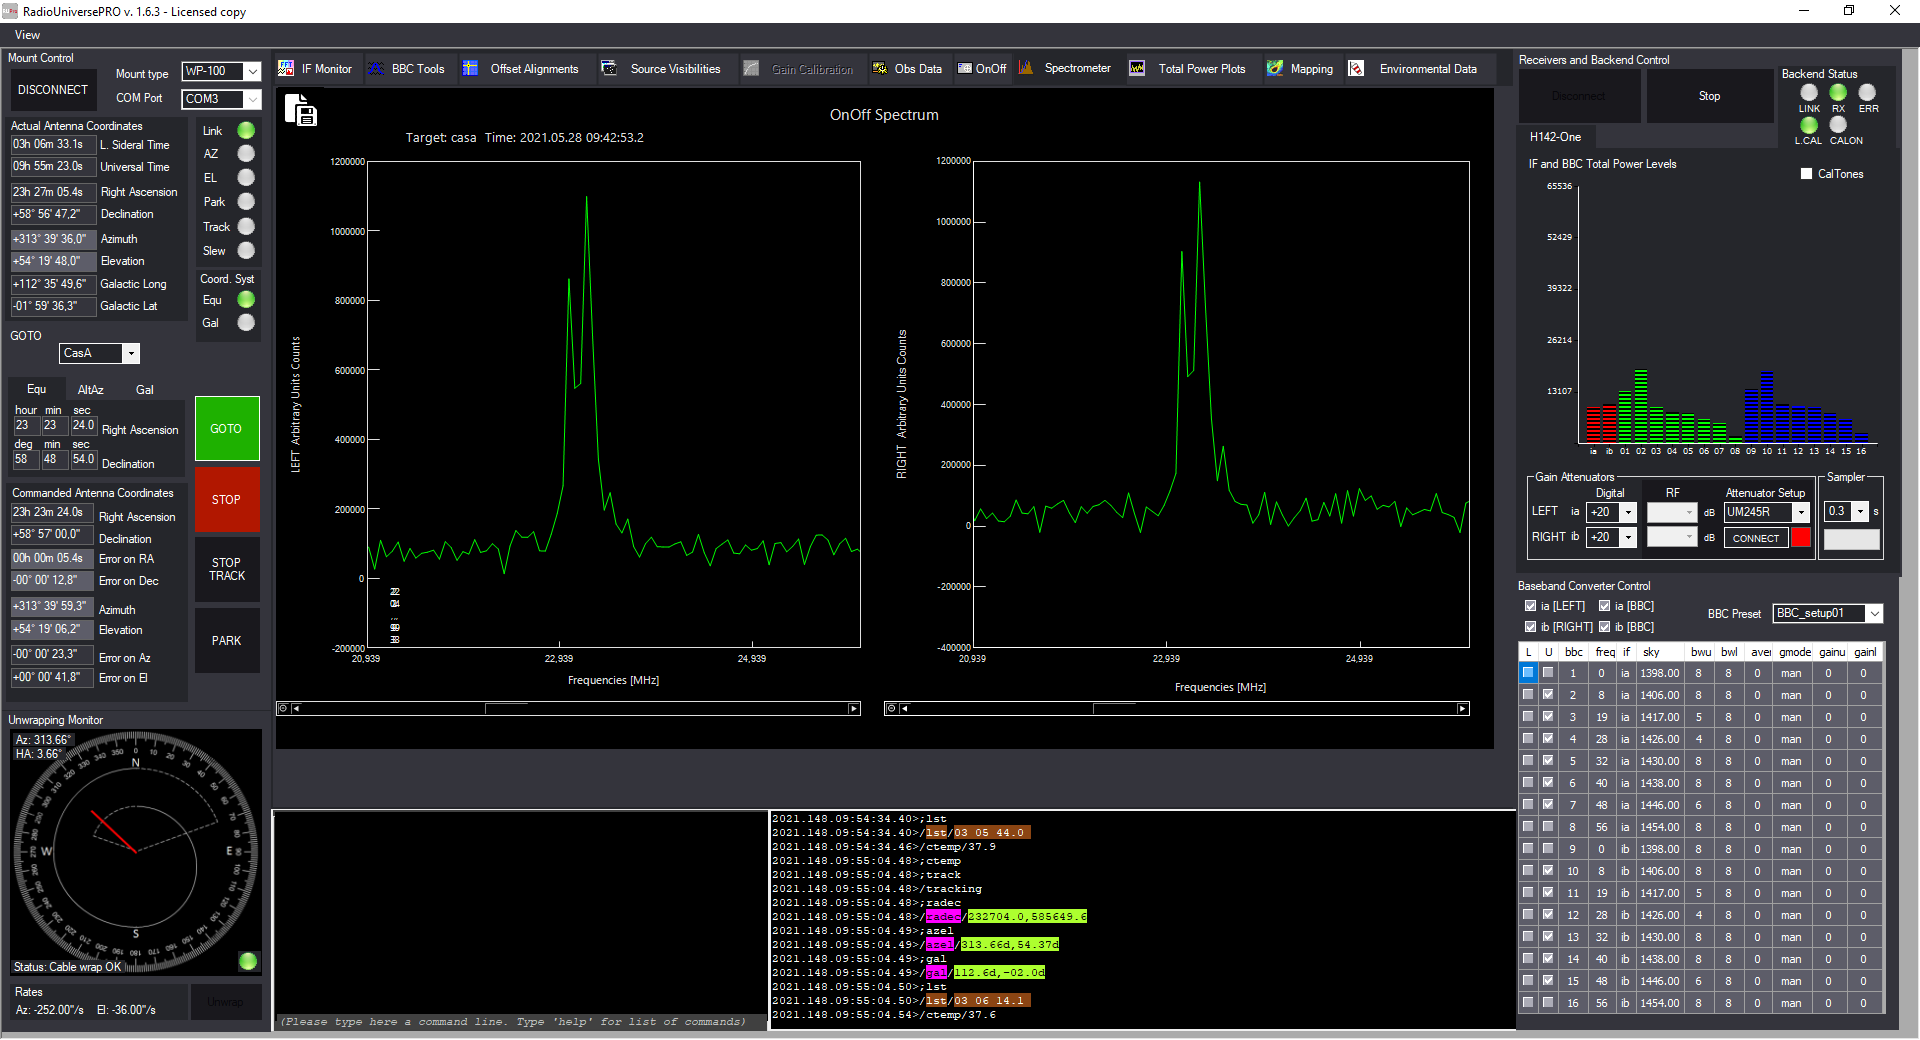
Then, in order to highlight the 1420 MHz neutral Hydrogen emission line, we recorded the Cassiopeia A spectrum. We used the calibrated spectrum On-Off feature of RadioUniversePRO: the software automatically records data from the radio source (“on” position) and then calibrates with a point in the sky away from the radio source (“off” position): the result is a calibrated spectrum as you can see in the image below (for the left and right polarization) where the emission of the hydrogen line at 1420 MHz is clearly visible.
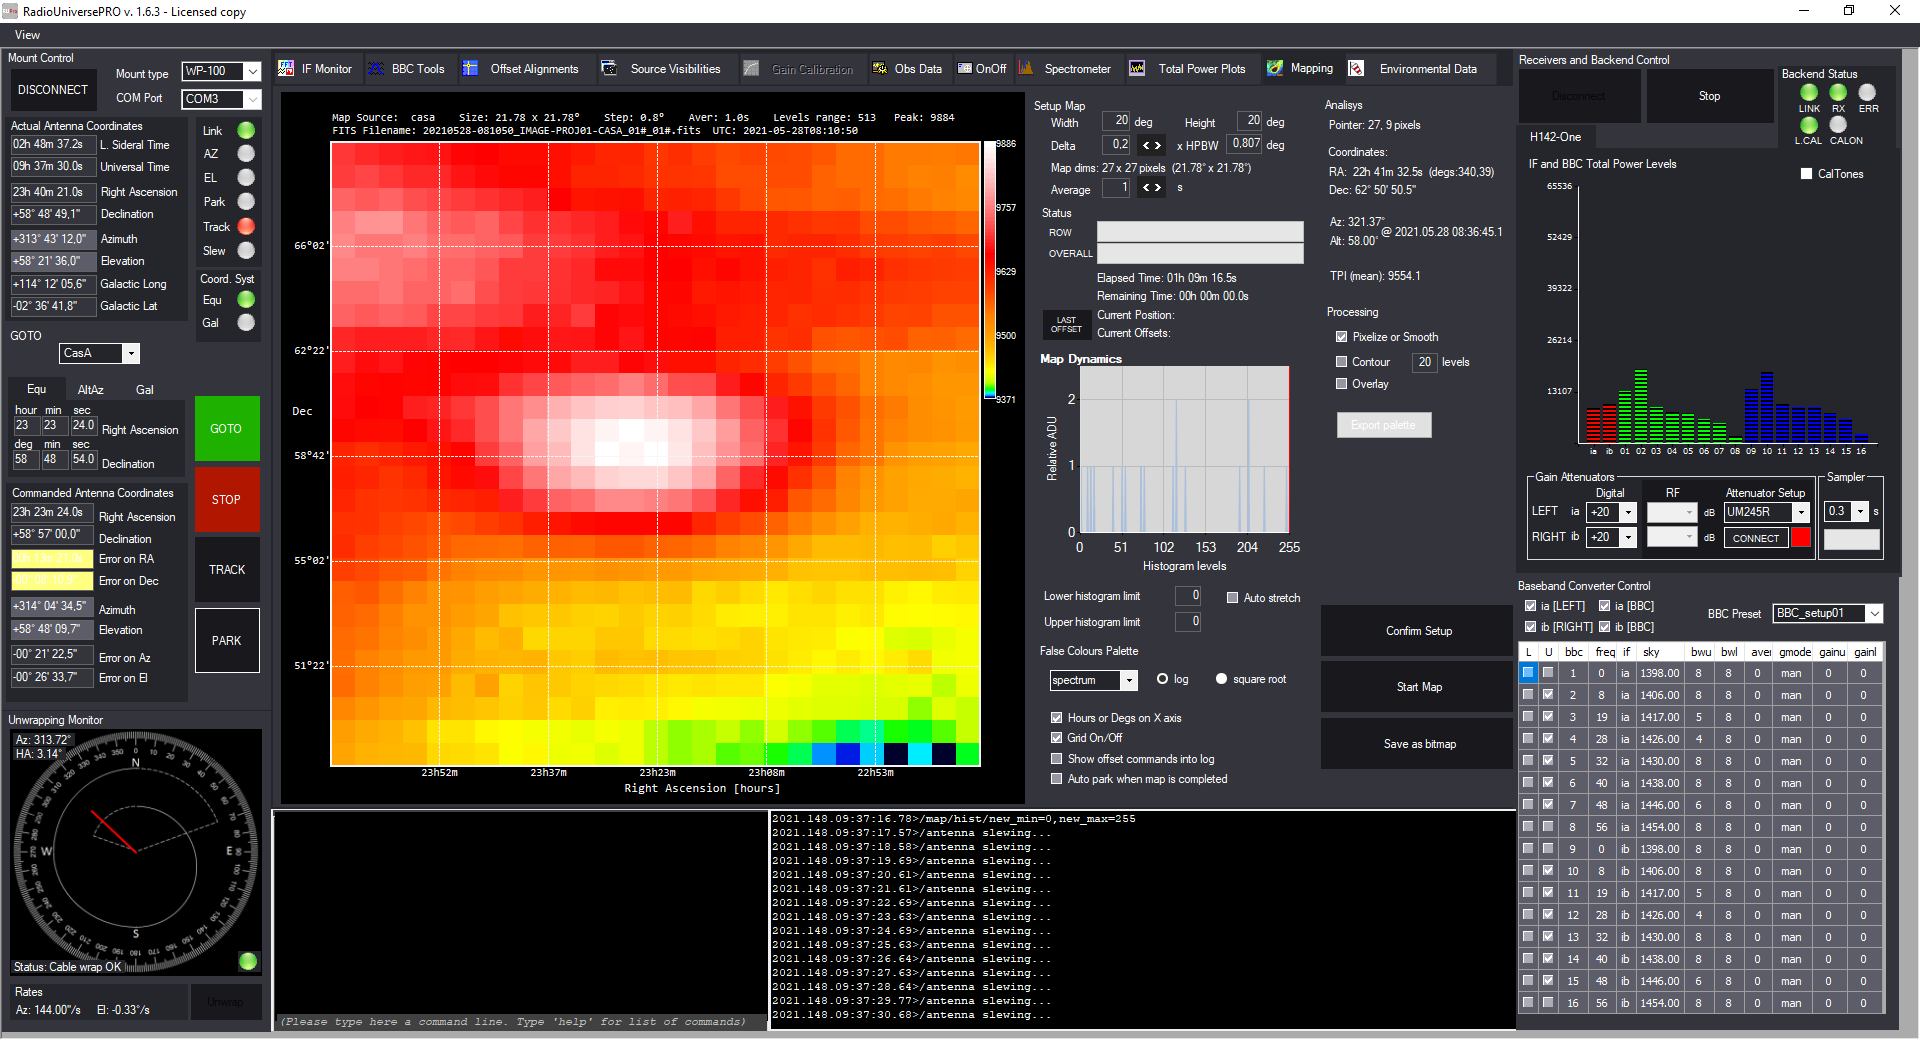
One of the most advanced features of RadioUniversePRO is the Mapping one and we used it to record a radio map of Cassiopeia A, by setting a capture area of 20×20 degrees, with 1 second of integration for each point and a separation between the points of 0.8 degree. As you can see in the image below, the map shows an increase in the signal at the map center, just where we expected Cassiopeia A to be.
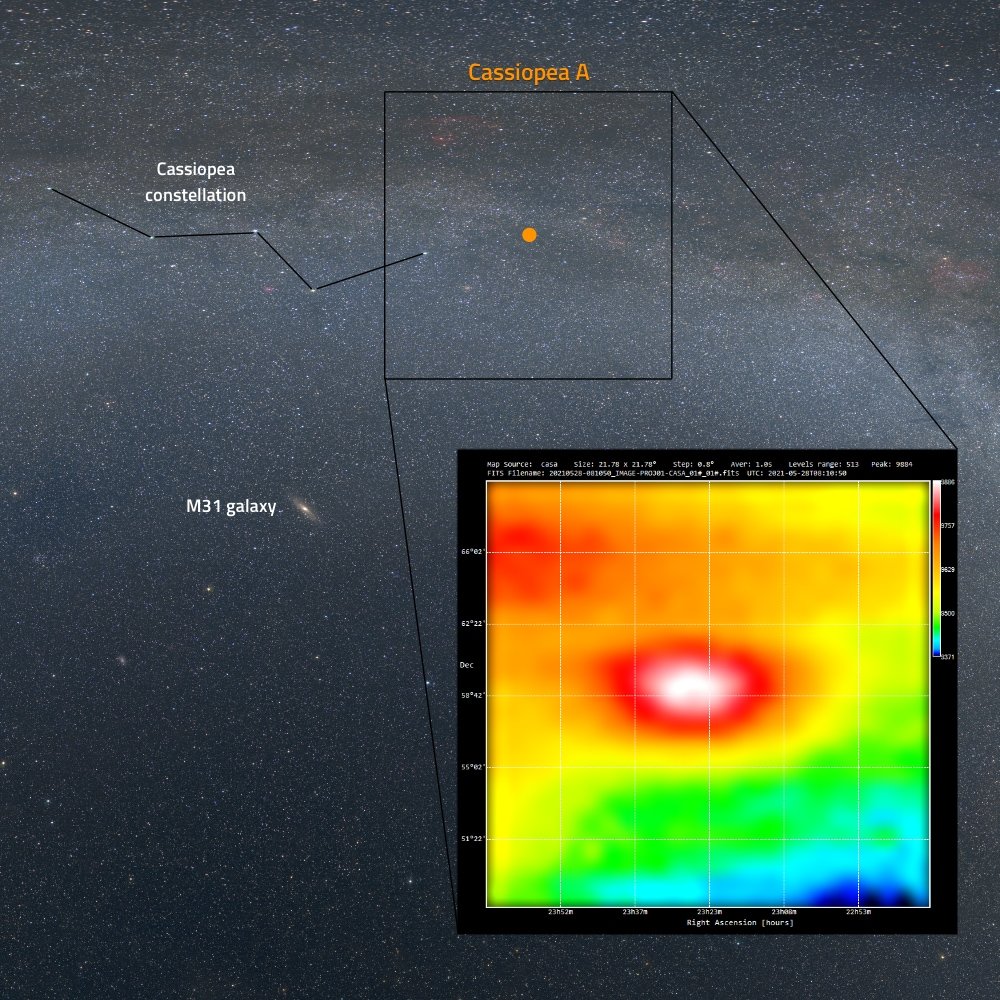
By saving recorded data in FITS format (just like the professional radio telescopes) we can also extract the data that can be processed with different softwares, like the NASA FITS Viewer. The radio map captured by the SPIDER 300A radio telescope has been compared to an optical image, as you can see in the image below. It is easy to see how, in an area apparently empty of particular objects, the SPIDER 300A radio telescope instead detects a strong radio source, the supernova remnant known as Cassiopeia A in the radio sources nomenclature.
SPIDER is the radio telescope developed and designed by PrimaLuceLab in order to allow everyone to make real radio astronomy without the need of being a radio astronomer! Click here to discover the full line of SPIDER radio telescopes.
