Taurus A recorded with SPIDER 300A radio telescope
Taurus A is the radio source in Taurus constellation that corresponds to the Crab Nebula (M1), the supernova remnant exploded on July 4, 1054 and noted by Chinese and Arabian astronomers of the time. Since then, the gas cloud has expanded and today is over 6 light years large. In this article we see how the SPIDER 300A radio telescope “discovered” it by capturing the radio waves emitted by Taurus A and converting them into a radio map, a real photograph in radio waves of this nebula. In fact it is believed that Taurus A emits radio waves for synchrotron radiation caused by electrons in fast spiral motions around magnetic field lines generated by the pulsar inside it. Thanks to the WEB300-5 3 meter diameter antenna and the 1420 MHz H142-One receiver, the SPIDER radio telescope was able to easily record the weak signal and, thanks to the precise mount and pointing system, it generated a radio map with the same technique used by professional radio telescopes.
Studying the sky at the frequency of 1420 MHz has several advantages including the ability to capture radio waves even during the day and through the clouds. But at this frequency the electromagnetic emission of many radio sources is quite weak (in fact, professional radio telescopes use very large antennas and are very expensive). At the frequency of 1420 MHz the strongest radio sources are:
- Sun: flux about 40000 Jansky
- Cassiopea A: flux about 2400 Jansky
- Centaurus A: flux about 1700 Jansky
- Cygnus A: flux about 1600 Jansky
- Sagittarius A: flux about 1600 Jansky
- Vela X: flux about 1600 Jansky
- Taurus A (M1): flux about 875 Jansky
- Orion A (M42): flux about 520 Jansky
- NGC2237: flux about 260 Jansky
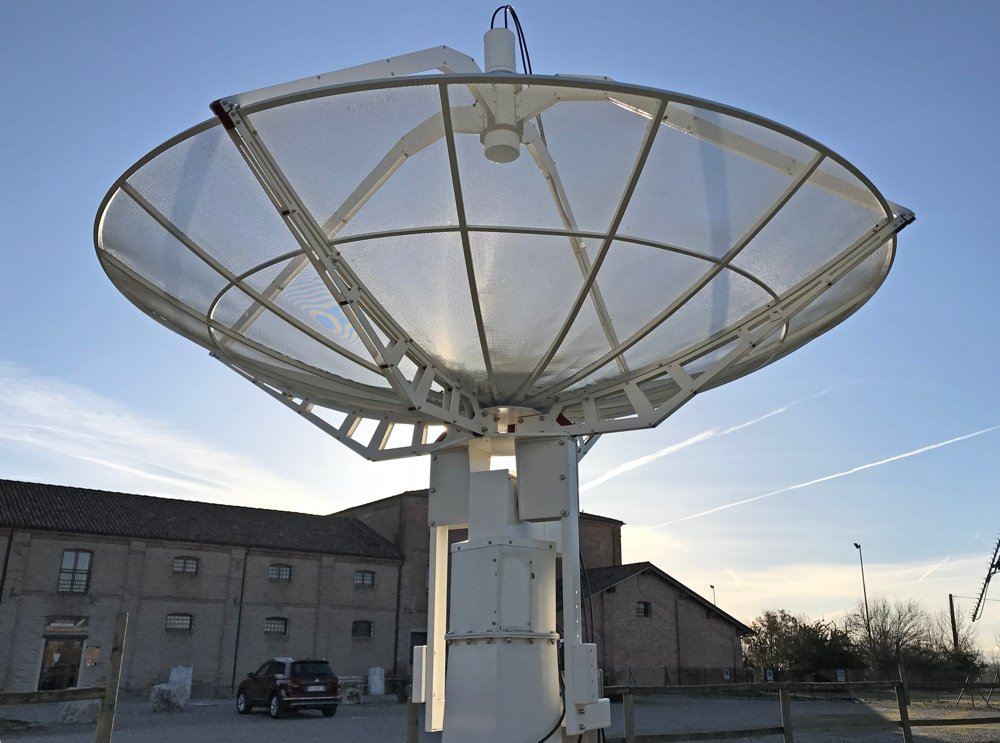
With SPIDER, the Sun is so strong we can use it as reference radio source to align the mount on the fly. All the other radio sources are weaker but the high sensitivity of the SPIDER radio telescope allow you to really record them. In order to verify this, we used the SPIDER 300A radio telescope installed in Marcello Ceccarelli visitor center in Medicina (Bologna, Italy – near the professional radio telescopes of INAF) to record a radio map of Taurus A and demonstrating the features of RadioUniversePRO control software that comes with the SPIDER radio telescope.
A radio telescope is different from an optical telescope by many aspects: one of these is that it collects radio waves from a single area in the sky. Just to give an example, it’s like having a telescope with a CCD camera that comes with a single large pixel. In order to create radio maps, technique consists in moving the antenna with small movements and, for every sky position, record radio waves coming from space tracking the sky apparent movement. Then the SPIDER antenna is moved to a new position and record the next pixel value. For every pixel, RadioUniversePRO software calculates the total amount of radio waves captured and displays this value with a color based on a color scale chosen by the user.
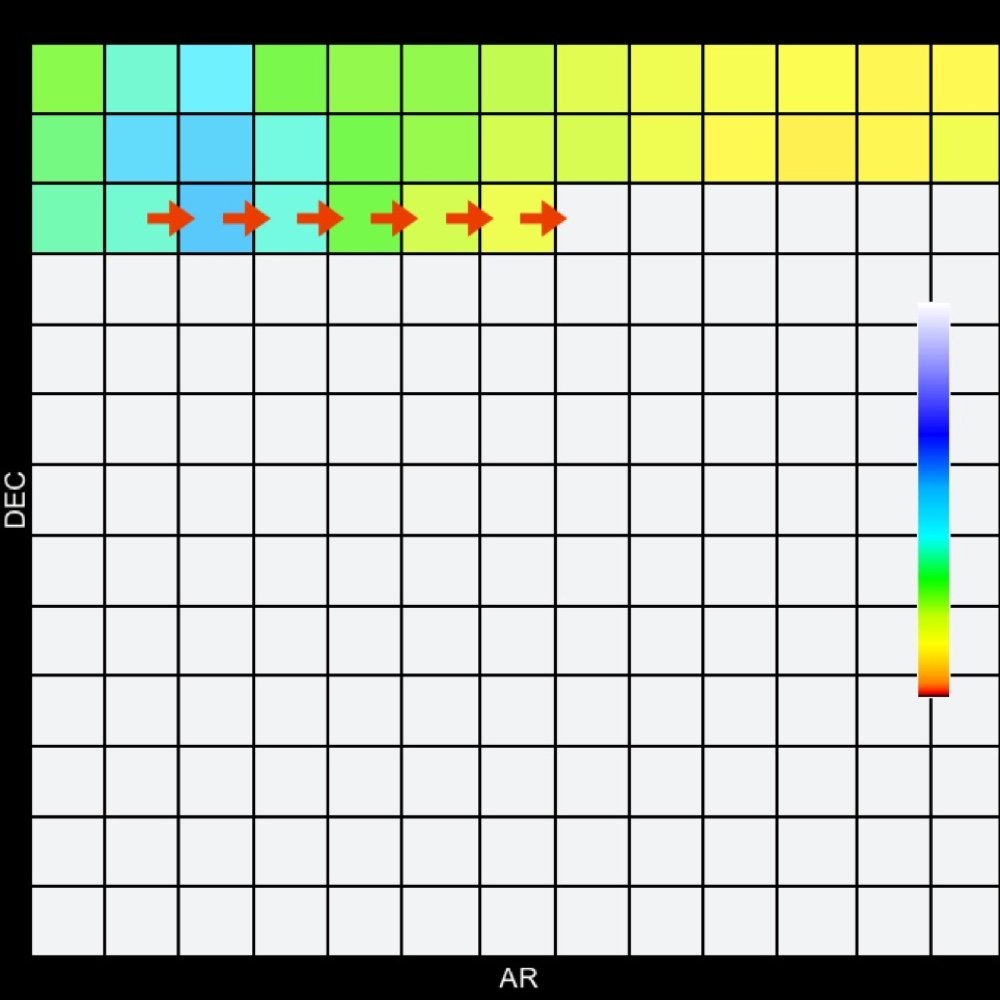
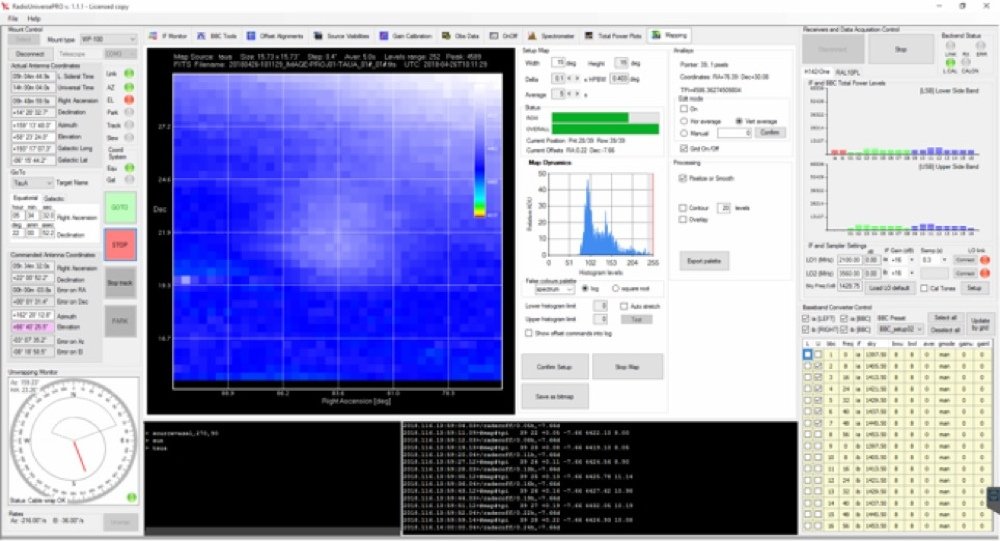
RadioUniversePRO software allows you to point the radio telescope to the precise sky position of the radio source, visualize in real time the bandwidth spectrum in frequency so you can see if you have artificial signal in it (allowing you to filter these from your recordings) and define radio map specifications like:
- Dimensions in degrees (AR e DEC)
- Pixel separation
- Integration time for every pixel
- Colour scale type for visualization
- Hystogram stretching
- Optional visualization with level curves
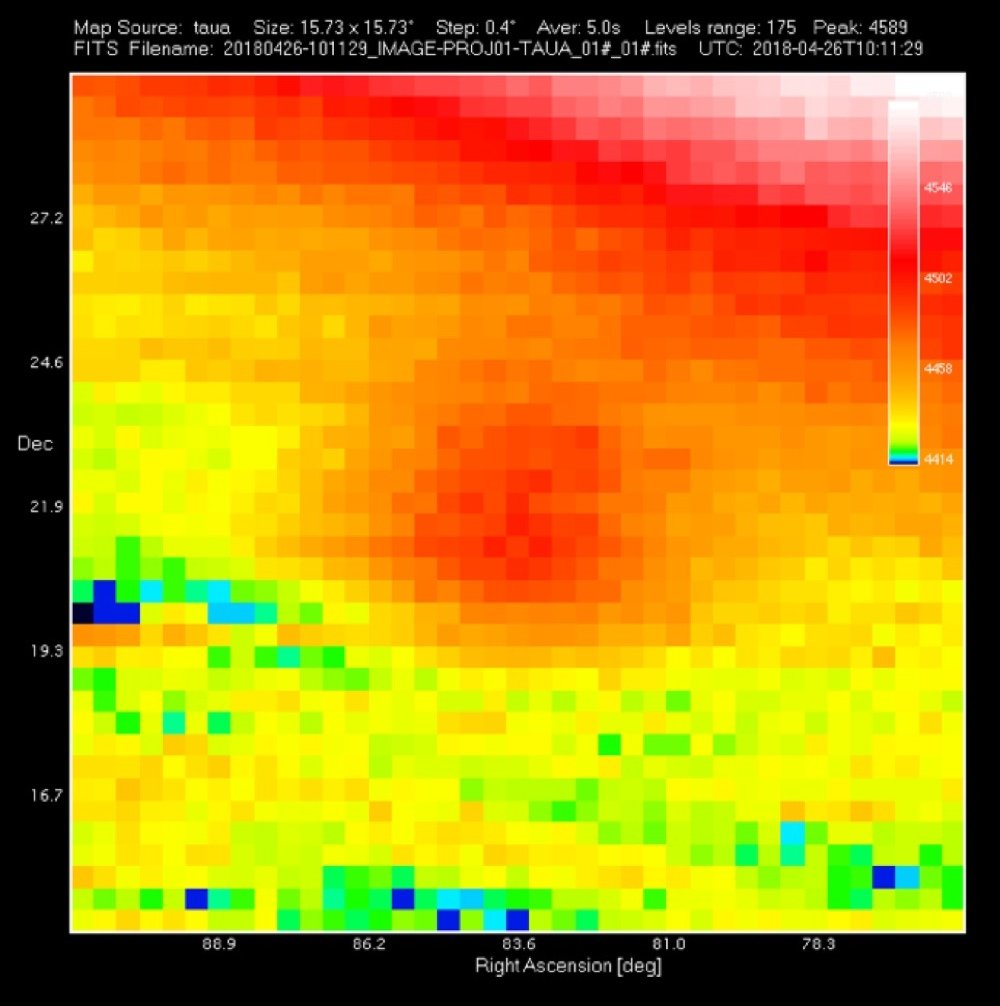
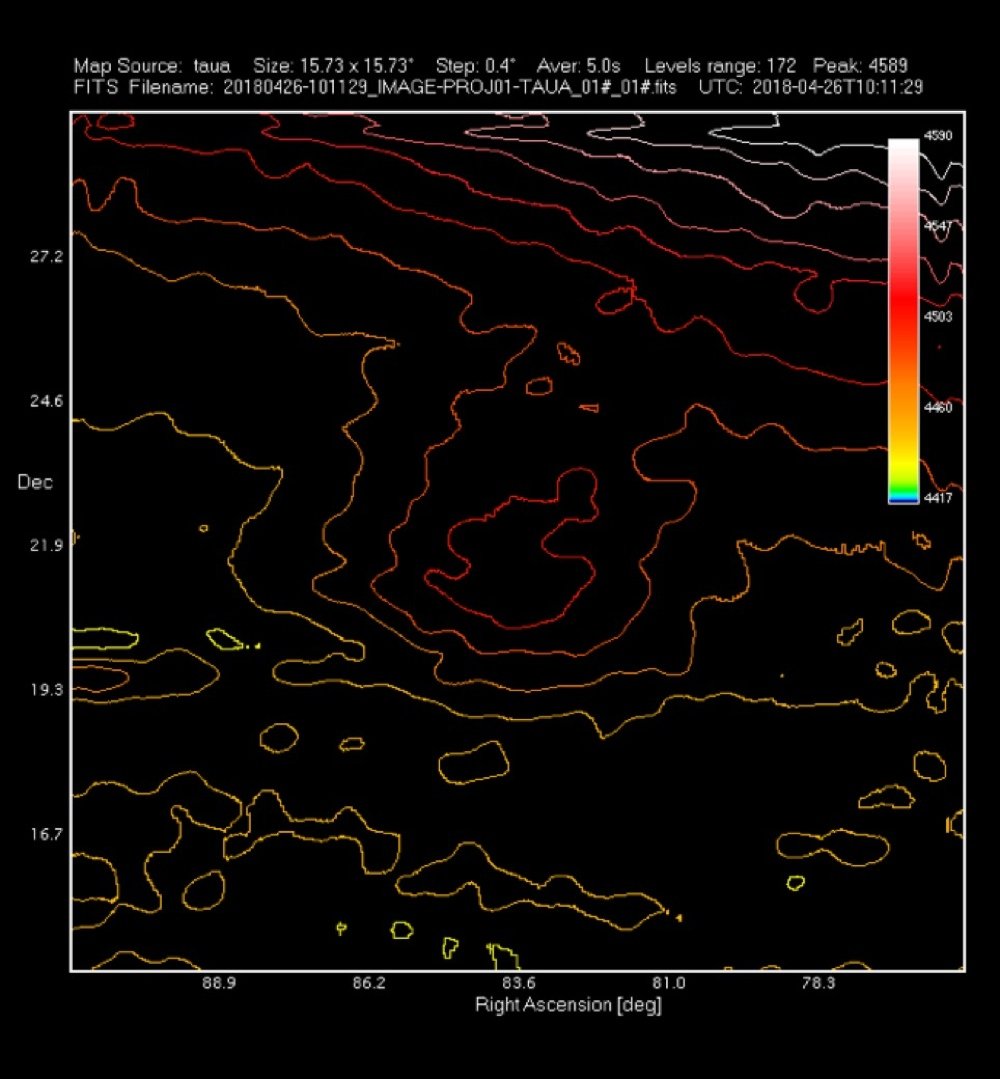
So we started a 3 hours capture, setting the following parameters in RadioUniversePRO:
- Map dimensions: 15 x 15 degrees
- Pixel separation: 0,4 degrees
- Integration time for every pixel: 5 seconds
The result is the map that we show in the image below. You can easily see the increase of the signal at the center of the map, corresponding to Taurus A position. The increase in the visible signal at the top right of the image is the Milky Way, in fact Taurus A does not lie perfectly on the plane of our galaxy but it is a few degrees away (as confirmed by the radio map). The image below shows the same radio map but displayed with the level curves.
This way we demonstrated that, thanks to the high sensitivity and pointing precision of the SPIDER radio telescope, it is possible to realize radio maps also of weak radio sources using the same techniques employed by professional radio telescopes!
